Trend Hunter: Find Gold with Our Free Trend Finder Screener!
Introduction
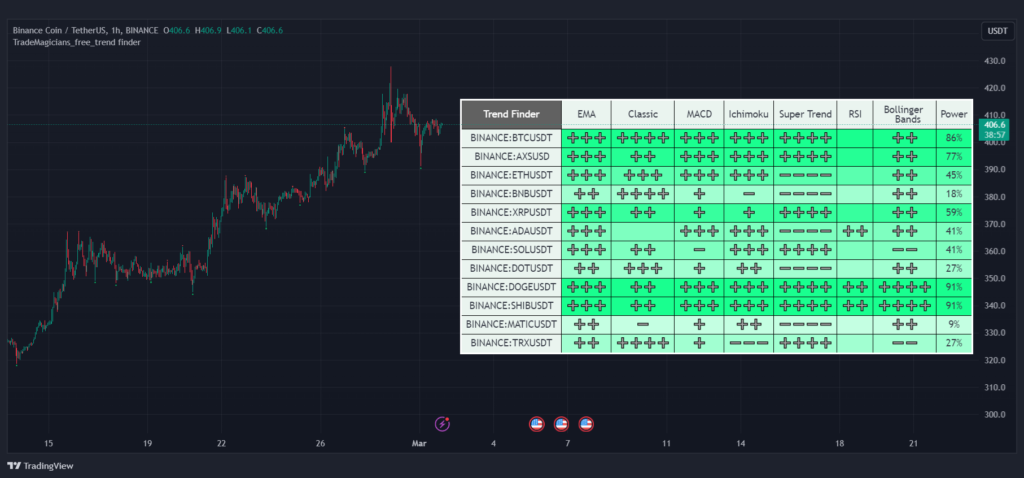
The purpose of this screener is to help you identify the trend direction of the market.
This is done by assigning weights to various signals, including:
Exponential Moving Average (EMA): EMA is a type of moving average that gives more weight to recent price fluctuations.
Classic: Finding Trends Using Swing Low and Swing High Liquidity Points.
MACD: MACD is a momentum indicator that uses two moving averages to show the strength of a trend.
Ichimoku: Ichimoku is a comprehensive indicator that uses multiple lines to show trend, support, and resistance.
SuperTrend: SuperTrend is a trend indicator that uses a moving average and the Relative Strength Index (RSI) to identify trends.
RSI: RSI is a momentum indicator that compares gains and losses to show overbought or oversold conditions.
Bollinger Bands: Bollinger Bands use two standard deviation bands around a moving average to show market volatility.
By combining the signals from these indicators, this tool can help you identify bullish and bearish trends with greater accuracy.
How the Screener Works:
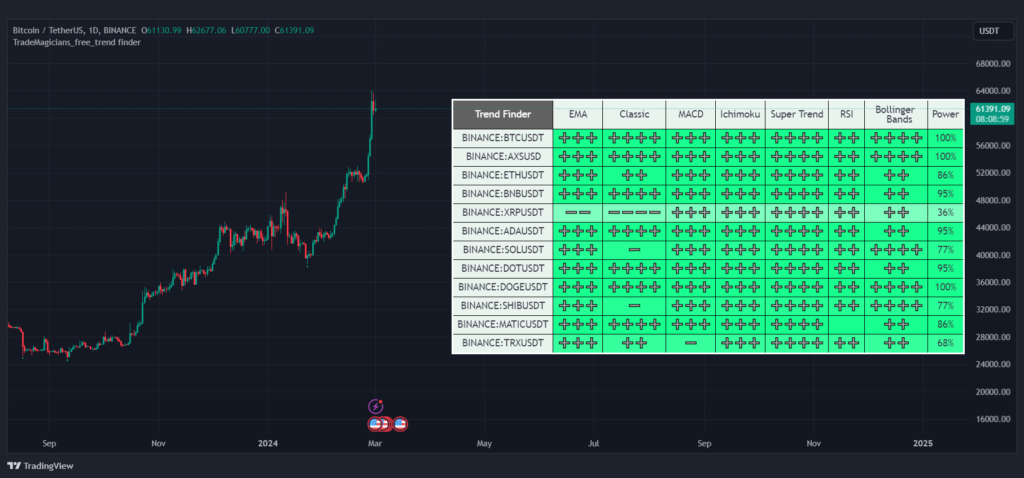
The screener analyzes multiple indicators and assigns scores based on predefined conditions for each indicator. These scores are then weighted and averaged to determine the overall strength of the bullish or bearish trends.
Here’s how the scoring works for each indicator:
| Indicator | Score Range |
| EMA | -3 to +3 |
| Classic | -4 to +4 |
| MACD | -3 to +3 |
| Ichimoku | -3 to +3 |
| Supertrend | -4 to +4 |
| RSI | -2 to +2 |
| Bollinger Bands | -3 to +3 |
Each indicator has a different range of possible scores.
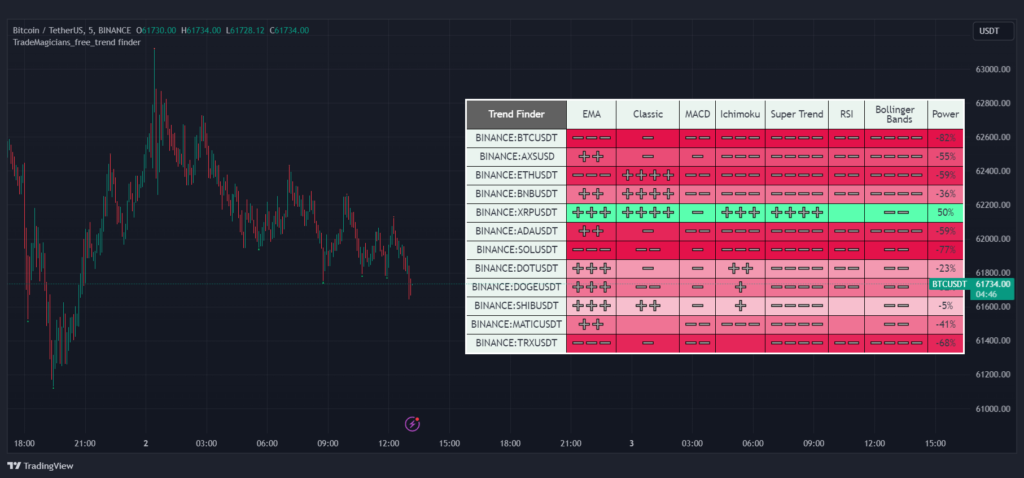
A higher positive number indicates a stronger bullish trend, while a lower negative number indicates a stronger bearish trend.
The screener uses a weighted average to calculate the final score, By using this comprehensive approach, the screener provides a more accurate and nuanced assessment of the overall market trend.
The screener is a powerful tool that can help you identify potential trading opportunities. However, it is important to remember that no tool is perfect and you should always do your own research before making any investment decisions.
Important points:
• No indicator can predict the market trend with 100% accuracy.
• To use this indicator effectively, you need to fully understand how each signal works.
• Before using this indicator in real trading, be sure to test it in a demo account.
Example:
Suppose the indicator gives the following signals:
• Both EMA and SMA are sloping upwards.
• In Classic method we finding Higher high and Lower low points to finding trends.
• MACD is rising and has crossed the signal line.
• Ichimoku has broken the Kumo cloud upwards.
• SuperTrend has issued a buy signal.
• RSI is in the overbought zone.
• Bollinger Bands are expanding.
These signals indicate that a bullish trend is likely forming.
However, keep in mind that this is just an example and you should do your own research before making any trading decisions.
TradeMagicians_free_trend_finder Indicator Settings and Logics
Activation:
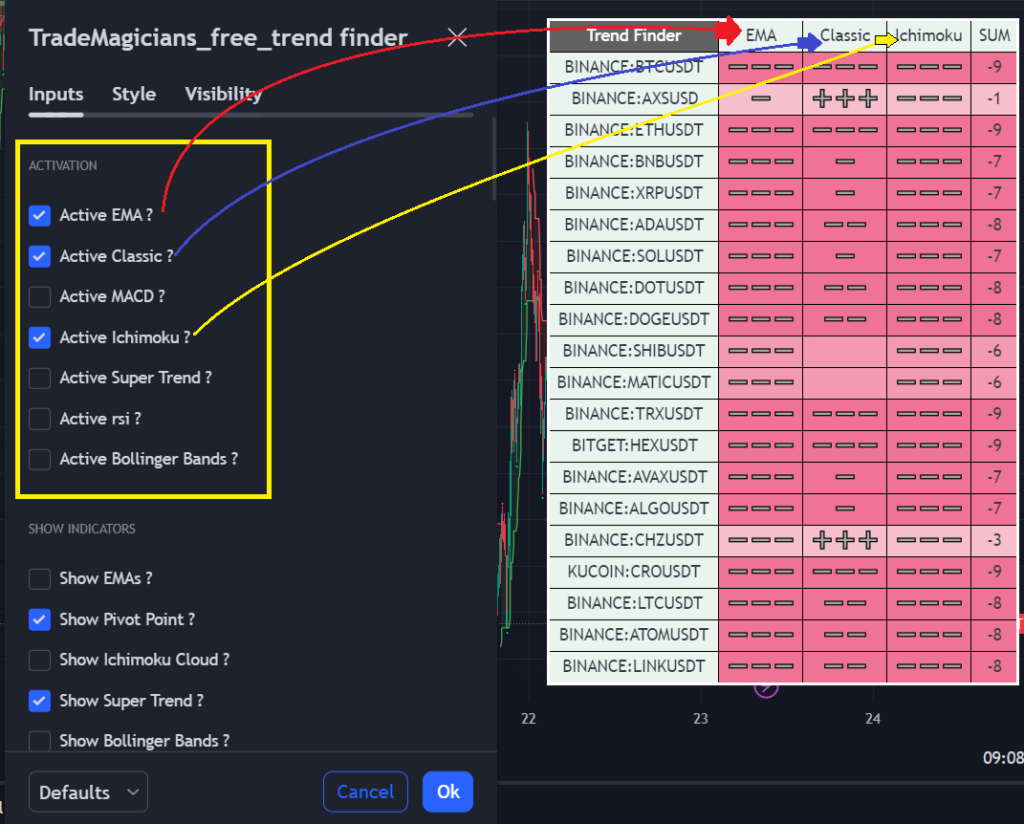
In the first section of the indicator settings, you can select the indicators that you want to see in the screener and that you want to include in your strategy. This will allow you to see the indicator in the screener and also calculate the signal received from that indicator in the screener’s SUM column.
Show Indicators:
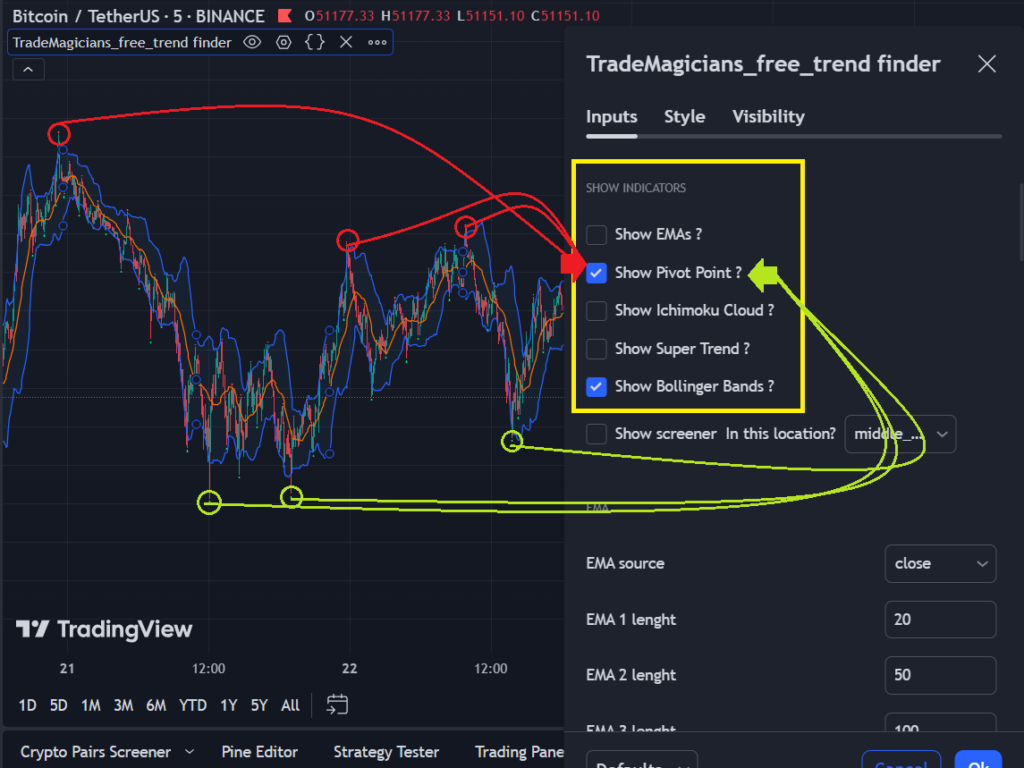
The checkboxes in the “Show Indicators” section are only for displaying the above indicators on the chart and do not affect the strategy or the calculated total. This section allows you to display all of the above indicators on the chart at the same time.
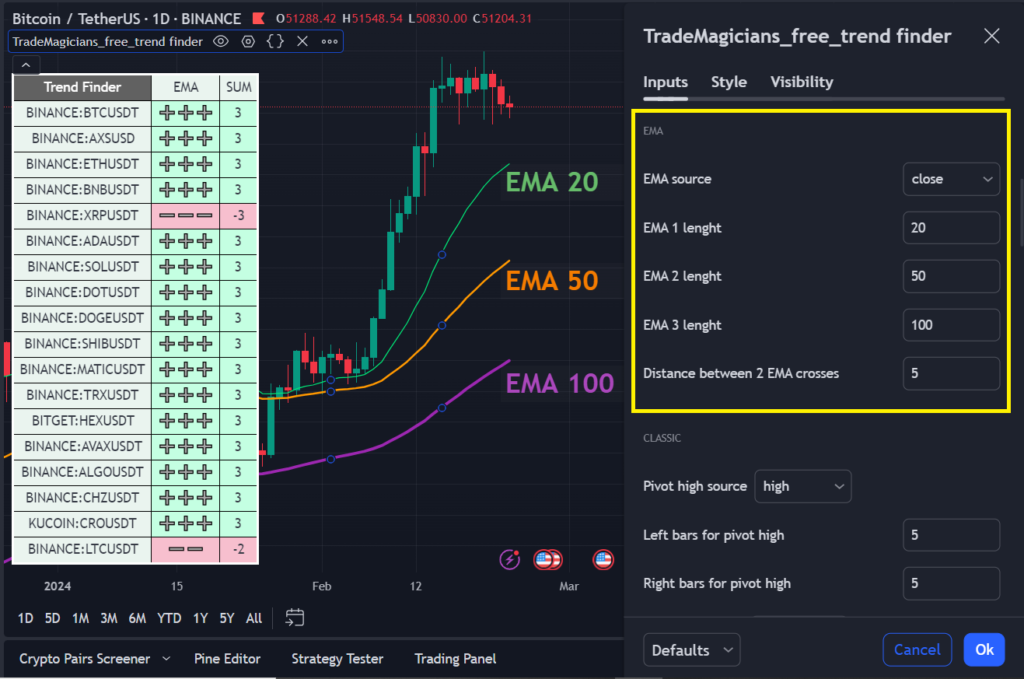
EMA Indicator Logic:
The EMA indicator uses three EMAs (20, 50, and 100 by default) to identify the trend. length of these three EMAs can be changed in the settings. The source for the EMA calculation is the closing price by default , but this can also be changed in the settings.
Upward Trend Conditions:
1. EMA 50 > EMA 100:
The first condition for an upward trend is that the EMA 50 must be above the EMA 100.
2. No Recent Crossovers:
The second condition is that the first condition must be met, and the EMA 50 must have been above the EMA 100 for a number of candles (specified in the settings as “distance between 2 EMA crosses“) before the current candle. There must also have been no crosses between these two EMAs during this period.
3. EMA 20 Crossover:
The third condition is that the EMA 20 must also have crossed over the EMA 50, in addition to the first two conditions.
Classic Swing Trading Strategy Logic:
This strategy is based on the idea that price movements tend to follow a trend. In a bullish trend, the price will typically make higher lows and higher highs. This strategy looks for specific patterns in the price action to identify potential buying and selling opportunities.
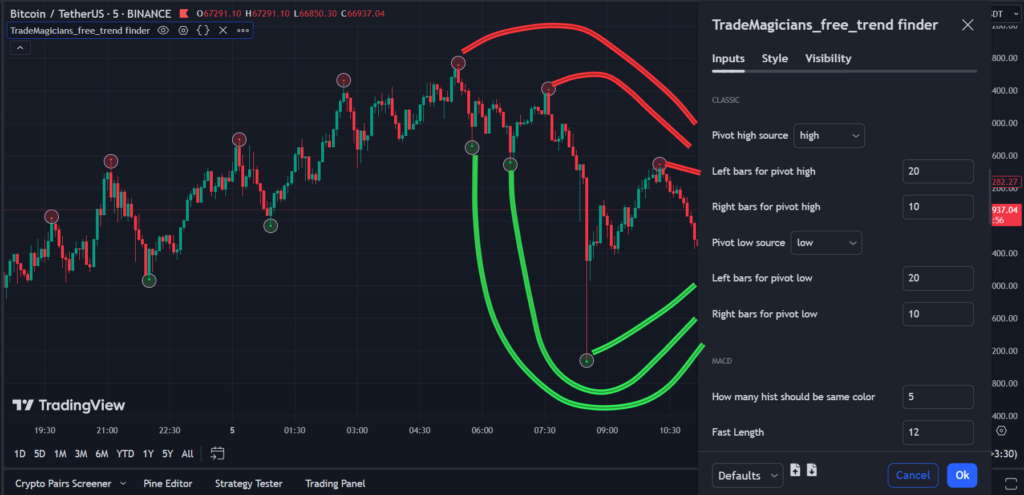
In your settings, you can choose the SOURCE for calculating pivots, as well as the depth of pivots from the left and right sides separately for pivot high and pivot low. Naturally, increasing the left & right bars for pivot low & high will help you discover deeper and more significant market swings.

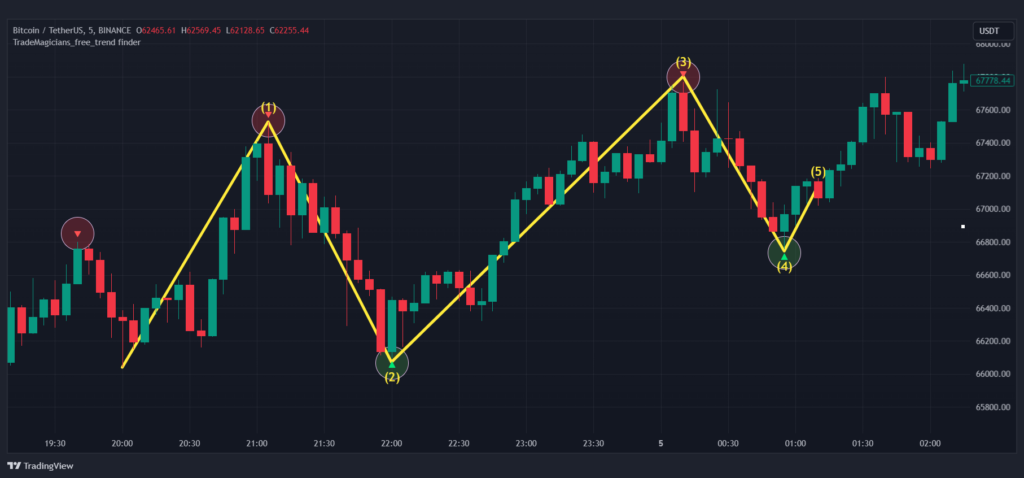
For identifying an uptrend using pivots, we have four conditional models:
- Condition 1: There should be a higher low.
- Condition 2: In addition to condition 1, there should be a higher high.
- Condition 3: Along with the above conditions, the latest high pivot should be evaluated between the two low pivots that formed the higher low.
- Condition 4: The fourth condition requires a complete bullish pattern, where not only the above conditions are met, but the entire pattern below has occurred.
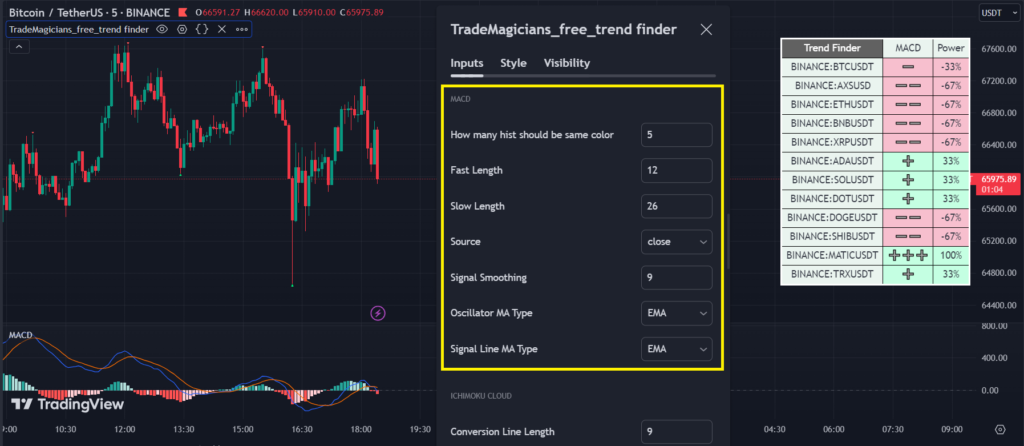
MACD Trend Following Strategy :
In the MACD settings section, you can adjust all MACD settings, including Fast & Slow length, Signal, and also select the source for calculating this indicator. Using conditions on the MACD line, signal line, and histogram, we identify the trend. In the settings section titled “how many histograms should be the same color,” you can choose how many consecutive green histograms indicate an uptrend.
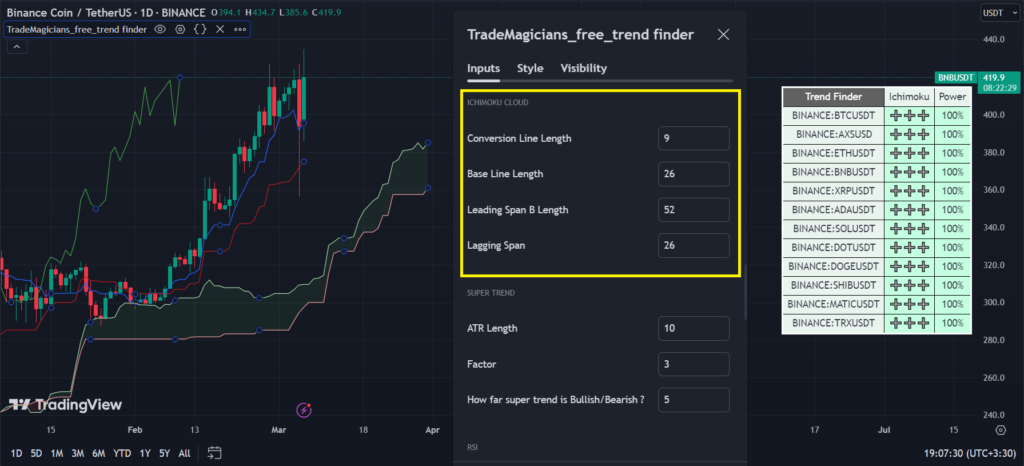
Ichimoku Trend Following Strategy:
In the Ichimoku settings section, you can adjust all settings of this indicator, including Conversion Line, Base Line, Leading Span B, and Lagging Span length. Utilizing the Ichimoku Cloud, Tenkan-sen, Kijun-sen, and Lagging Span, the trend can be accurately identified.
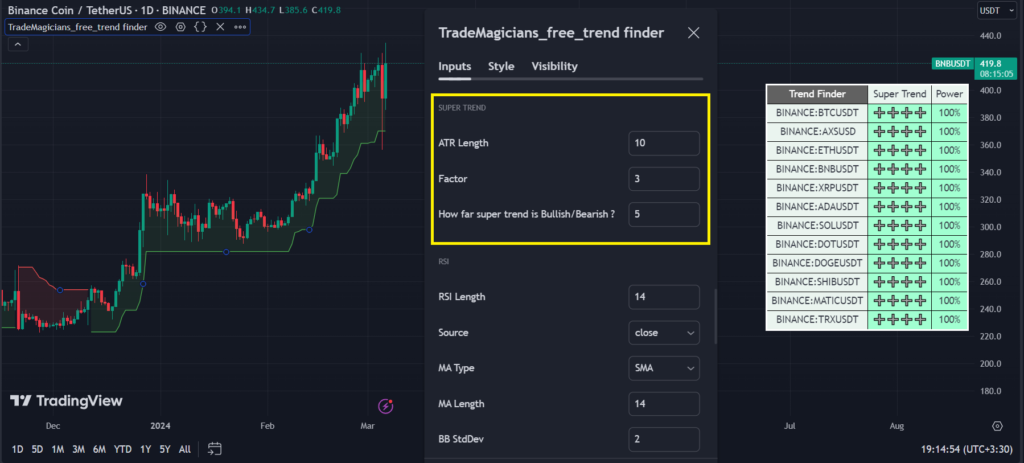
Super Trend :
The Super Trend indicator is specifically designed for trend detection and can effectively identify trends. You can adjust the ATR length and Factor settings, which are part of the Super Trend settings. Additionally, in the section labeled “how far super trend is bullish/bearish,” increasing this value helps in identifying stronger and more confidently trending movements.
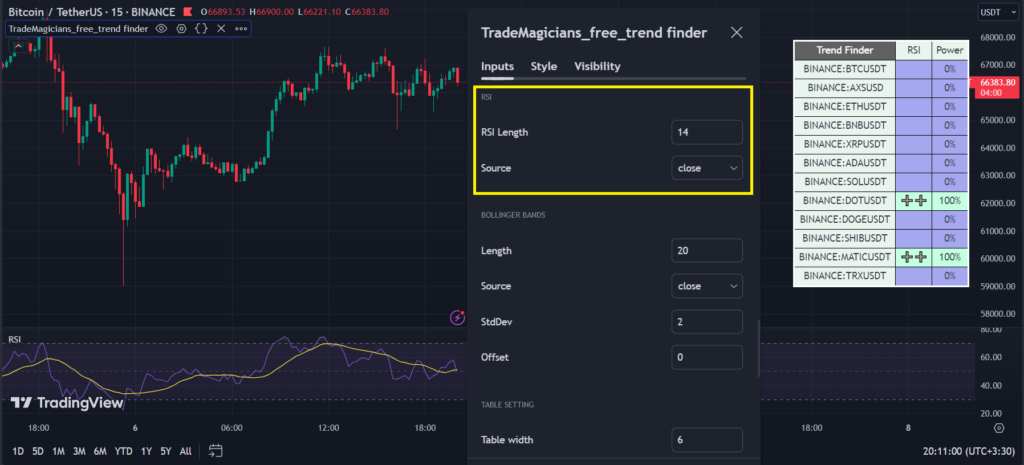
RSI indicator :
RSI (Relative Strength Index) is a momentum oscillator that measures the speed and change of price movements. It oscillates between 0 and 100 and is typically used to identify overbought or oversold conditions in a market. RSI values above 70 are often interpreted as overbought, suggesting that the price may be due for a downward correction, while RSI values below 30 are considered oversold, indicating that the price may be due for an upward correction.
You can set the length of RSI and choose the source for calculating RSI in the settings. With the help of RSI, you can identify overbought or oversold conditions, providing insights into upward and downward trends.
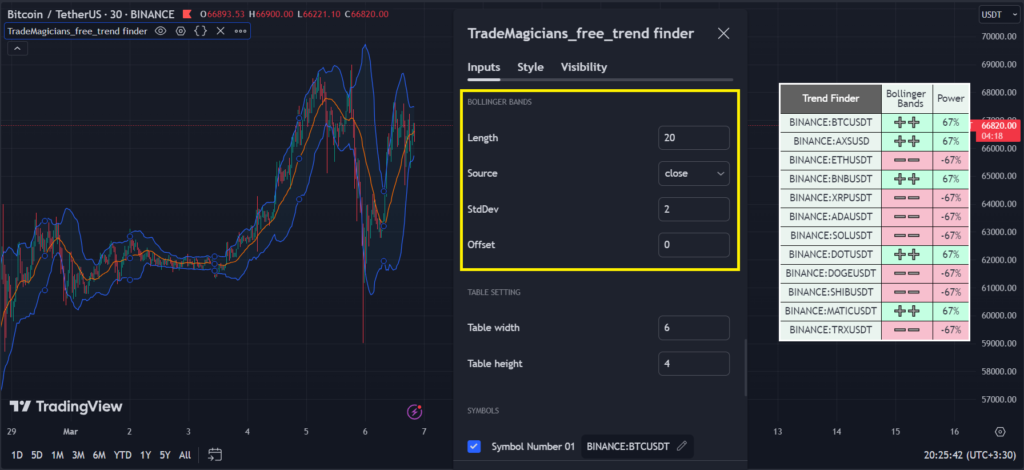
Bollinger Bands Trend Following Strategy:
Bollinger Bands are a popular technical analysis tool introduced by John Bollinger. They consist of three lines: a middle band, which is an N-period simple moving average (SMA), and two outer bands that are standard deviations away from the middle band. The distance between the outer bands widens or narrows based on market volatility.
You can adjust the settings of Bollinger Bands in the configuration. By examining the position of prices relative to the bands of this indicator, We can detect trends and gain insights into the market’s behavior.
Select pairs:
In the last section of settings, you can adjust the length and width of the screener. Additionally, you can select any currency pair you desire to monitor and analyze its trend based on your personalized settings.
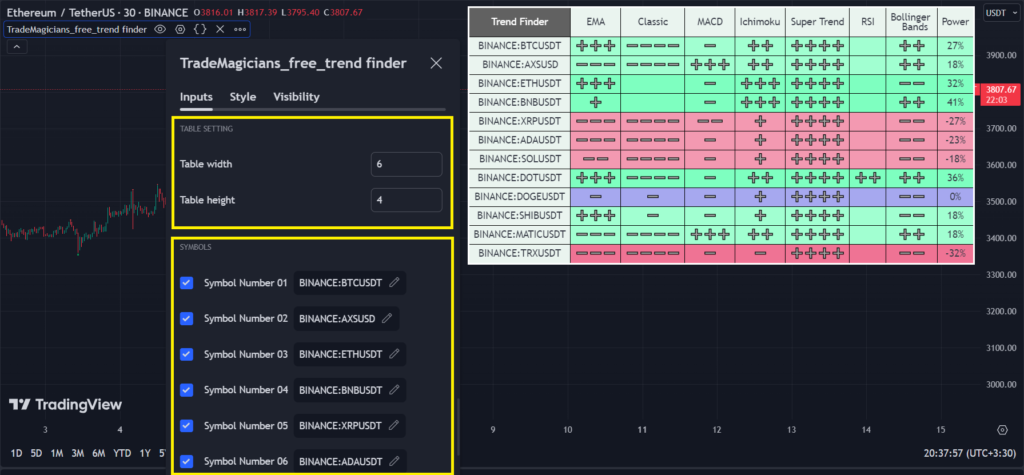
In this indicator, we have endeavored to identify the trends of various currencies in the best possible way. You can customize the settings and find configurations that align with your personality and trading style to maximize the returns from this screener.
It’s important to note that this indicator is based on specific calculations, and nothing in financial markets is guaranteed. Ultimately, remember to “do your own search” and conduct thorough research before making any trading decisions.
Leave a Reply